Description
The book is intended for professionals like you. You have some familiarity with cause analysis projects, but you’re looking for a simple and efficient cause investigation methodology – a more effective and insightful way of asking “why?”
Follows the Cause Road Map
The author provides a comprehensive taxonomy for every cause investigation. Supporting his instructions with diagrams, charts, and real-world examples from companies like yours, he takes you step-by-step through planning, completing, and documenting your investigation:
- Chapter 1 helps you determine the level of effort that your investigation will require, assess the level of effort needed, and determine the rigor needed. Your investigation needs to be as risk-informed as possible
- Chapters 2 through 5 offer a new and innovative structure – rigorous yet intuitively easy to remember – to identify the underlying causes for the event (Cause Road Maps) and conduct the investigation.
- Chapter 6 introduces conceptual human performance models that will allow you to begin focusing on the human behaviors involved.
- Chapters 7 and 8 present you with methods, tools, and techniques for carefully interviewing personnel.
- Chapters 9 through 13 “put the pieces together,” guiding you to analyze and model the event, determine corrective action, and document the investigations and findings.
Free Interactive Cause Analysis Tool
To fully implement Rowe’s Cause Road Map, you will need other tools to organize, analyze, and present the final results of your investigation. The author includes his downloadable Interactive Cause Analysis Tool – an easy-to-use tool in familiar spreadsheet format – free with your verified purchase of the book. The Interactive Cause Analysis Tool functions include:
- Help managing your cause investigation efforts.
- Providing supporting documentation for your report.
- Aiding in presenting the results.
- Structuring and sequencing of corrective action recommendations.
- Help assessing your organization’s Safety Culture.
“There are already many scientific tools to help us understand the physical causes for machine failures; the challenge now is to find a way of investigating human performance failure modes… humans are often a major source of slips, lapses, and mistakes.” – Chester D. Rowe
This book is an ideal support tool for Cause Analysis professionals working as Managers of Plant Engineering, Managers of Nuclear Engineering, Managers of Design Engineering, Plant Managers, Outage Managers, Managers of Nuclear Assurance (Quality Assurance), Materials (Supply/Procurement) Managers, Managers of Operator Training, Managers of Support Training, Managers of Human Resources, Senior Engineers and other Senior level personnel working or supporting these groups.
2018, 240 pages PLUS downloadable Interactive Cause Analysis Tool (on registration).
Contents
Table of Contents
DEDICATION III
ACKNOWLEDGMENTS III
INTRODUCTION XIII
References xvi
CHAPTER 1: GETTING STARTED 1
1.1 Two Tools to Begin the Investigation 1
1.1.1 Investigation Effort and Rigor Assessment Tool 2
1.1.2 Checklist Tool 7
CHAPTER 2: THE CAUSE ROAD MAP TAXONOMY 13
2.1 Conceptual Basis for the Cause Road Map 13
2.1.1 Find the Cause Model Compared to Swiss Cheese Model 14
2.2 Introducing the Cause Road Map 18
2.2.1 Major Causal Factor Groups (Map 1) of Cause Road Map 18
2.3 Cause Road Map Defined as a Taxonomy 20
2.4 Cause Road Map as a Data Trending Source 20
References 22
CHAPTER 3: HUMAN PERFORMANCE RELATED MAPS 23
3.1 Human Performance Related Maps 23
3.1.1 Cause Road Map − Map 2 (Human Errors) 24
3.1.2 Cause Road Map – Map 3 (Error Drivers) 28
3.1.3 Cause Road Map − Map 4 (Flawed Defenses) 35
3.1.4 Cause Road Map – Map 5 (Failed Oversight/Flawed Assessments) 40
3.1.5 Cause Road Map – Map 6 (Latent Errors/Flawed Decisions) 42
References 49
CHAPTER 4: MACHINE/MATERIAL/HARDWARE FAILURE MAPS 51
4.1 Machine/Material/Hardware Failure Related Maps 51
4.1.1 Machine/Material/Hardware Failure Related Map A 53
4.1.2 Machine/Material/Hardware Failure Related Map B 56
References 62
CHAPTER 5: USING THE CAUSE ROAD MAP 63
5.1 Using the Cause Road Map 63
5.1.1 Step 1 65
5.1.2 Step 2 – Human Error 66
5.1.3 Step 3 – Error Drivers 67
5.1.4 Step 4 – Flawed Organizational or Programmatic Defenses 68
5.1.5 Step 5 – Flawed Assessment Capability 69
5.1.6 Step 6 – Latent Management Practice Weaknesses 70
5.1.7 Step 7 – Repeat for another observation 71
5.1.8 Step 8 – Safety Culture 72
5.2 Displaying the Results 73
5.2.1 Human Performance Evaluation Briefing Report 73
5.2.2 Hardware/Material/Design Failure Evaluation Briefing Report 74
5.2.3 Human Performance Evaluation driven from previous Failure Evaluation 76
5.3 Capturing the Details 77
References 84
CHAPTER 6: HUMAN PERFORMANCE BASICS 85
6.1 Theoretical frame 85
6.1.1 Skill-Based 86
6.1.2 Rule-Based 86
6.1.3 Knowledge-Based 87
6.1.4 Slips, Mistakes, and Violations 87
6.2 Tools & Interventions Supporting this Theoretical Framework 88
6.2.1 Skill-Rule-Knowledge (Balance Beam) Tool 88
6.2.1.1 Corrective Actions Checklist for Skill-Based Errors 94
6.2.1.2 Corrective Actions Checklist for Rule-Based Errors 95
6.2.1.3 Corrective Actions Checklist for Knowledge-Based Errors 95
6.2.2 Substitution Test Tool 96
References 98
CHAPTER 7: EFFECTIVE INTERVIEWING 99
7.1 Planning the Interview 100
7.2 Opening the Interview 103
7.3 Conducting the Interview 103
7.3.1 Open-ended Questions 103
7.3.2 Closed-ended Questions 104
7.3.3 Follow-up Questions or Questioning to the Void 104
7.3.4 Other Tips to a Successful Interview 105
7.4 Closing the Interview 106
7.5 Recording 106
References 108
CHAPTER 8: ANALYSIS TOOLS AND TECHNIQUES 109
8.1 Tool Types and Use Matrix 109
8.2 Comparative Event Line 111
8.3 Failure Modes and Effects Analysis 114
8.4 Barrier Analysis 117
8.4.1 Classifying Barrier Functions 118
8.4.2 Typical Barrier Analysis Checklist Questions 119
8.4.3 Barrier Analysis Display Format 119
8.4.4 Advantages and Weaknesses of Barrier Analysis Tool 121
8.5 Change Analysis 122
8.5.1 The Five Steps in Change Analysis 122
8.5.2 A Cause Analysis Example 124
8.5.3 Advantages and Weaknesses of Change Analysis Tool 128
8.6 Task Analysis 128
8.6.1 Two Types of Task Analysis 129
8.6.2 Steps in Task Analysis 129
8.6.3 Task Analysis Example 130
8.6.4 Advantages and Weaknesses of Task Analysis Tool 131
8.7 Common Cause Analysis 132
8.7.1 Using Common Cause Analysis: Nuclear Power Station Example 132
8.7.1.1 Approach to the Seven Events 132
8.7.1.2 Suggested Common Cause Analysis Method 133
8.8 The 5 Why’s/Why Staircase 138
References 141
CHAPTER 9: EVENT MODELING AND ANALYSIS TOOLS 143
9.1 Causal Factor Trees 143
9.1.1 Advantages and Disadvantages of Causal Factor Tree 145
9.2 Events and Causal Factors (E&CF) charts 146
9.2.1 Defining Problems 147
9.2.2 Considerations 147
9.2.3 How to Develop the E&CF Chart 148
9.2.4 Formatting 149
9.2.5 The Dump Truck Accident E&CF Chart 151
9.2.6 E&CF Charting Advantages and Disadvantages 153
References 154
CHAPTER 10: EVENT MODELING AND ANALYSIS TOOLS 155
10.1 Investigation Tools Integration Protocol 155
10.2 Commonalities Matrix 157
CHAPTER 11: EXTENT OF CONDITION AND EXTENT OF CAUSE 163
11.1 Examining the Broader Implications of an Event 163
11.1.1 Three-Step Approach to Implications 164
11.2 Step 1: Define Same and Similar Conditions 165
11.2.1 Extent of Condition Assessment 166
11.2.2 Extent of Cause Assessment 166
11.3 Step 2: Determine the Potential Consequences and Risks 167
11.4 Step 3: Actions Matrix 169
CHAPTER 12: CORRECTIVE ACTIONS 175
12.1 Eight Basic Elements of Corrective Actions 175
12.2 Effective Corrective Action Structure Elements 176
12.3 Ten Criteria for Effective Corrective Actions 177
12.4 SMART Corrective Actions 179
12.5 Specific Corrective Actions 180
12.6 Relative Effectiveness of Types of Corrective Actions 180
12.7 Measurable Corrective Actions 181
12.8 Assigned and Accepted Corrective Actions 183
12.9 Realistic Corrective Actions 183
12.10 Timely Corrective Actions 185
12.11 Comprehensive Effectiveness Review Plan 186
12.11.1 Assigning Effectiveness Reviews 186
Recommended Reading 191
CHAPTER 13: DOCUMENTATION AND REPORTING 193
13.1 Points to Remember when Reporting Investigation Results 193
13.2 Use of Graphics and Pictures in Reports 194
13.3 Report Specifics 195
13.3.1 Executive Summary 195
13.3.2 Problem Statement 196
13.3.3 Investigation Scope 197
13.3.4 Event Discussion 198
13.3.5 Compensatory and Immediate Actions 198
13.3.6 Extent of Condition/Cause 198
13.3.7 Event Significance 198
13.3.8 Review of Operating Experience 199
13.3.9 Presenting Results 200
13.3.9.1 Before the Presentation 200
13.3.9.2 Presentation Scenarios 200
13.3.10 Use of Charts and Graphics 200
13.3.11 Commonalities Matrix 201
13.3.12 Human Performance Précis 201
References 204
CHAPTER 14: FINAL THOUGHTS 205
ABOUT THE AUTHOR 208
CREDITS 210
Excerpt from the Introduction
During a return trip from a conference on root cause analysis, I had the pleasure of sitting next to a mother who was taking her young daughters on their very first flight in a jet plane. As is typical, the three-year-old’s “tool” for finding the “cause” for our plane’s takeoff was to simply ask her mother “why?” While the mother’s answer that jet planes just needed to go very fast was sufficient to satisfy her daughter, aircraft engineers and scientists have gained a much more fundamental understanding of flight. Fortunately, the aviation industry is now much more concerned with why planes have accidents. In fact, because of the adverse social and economic impacts of accidents, most companies and industries are very concerned with preventing failures.
This book is intended for experienced individuals with some familiarity with cause analysis projects who are looking for simple and efficient cause investigation methodology. From this prospective, what is needed is an effective and insightful way of asking “why?” While there are numerous investigation tools for identifying the causes for problems, this book introduces a tool (the Cause Road Map) that is rigorous, yet is still intuitively easy to use and remember. As shown in Figure 0-1, studies have shown that most accidents and equipment failures are the result of some sort of human error.
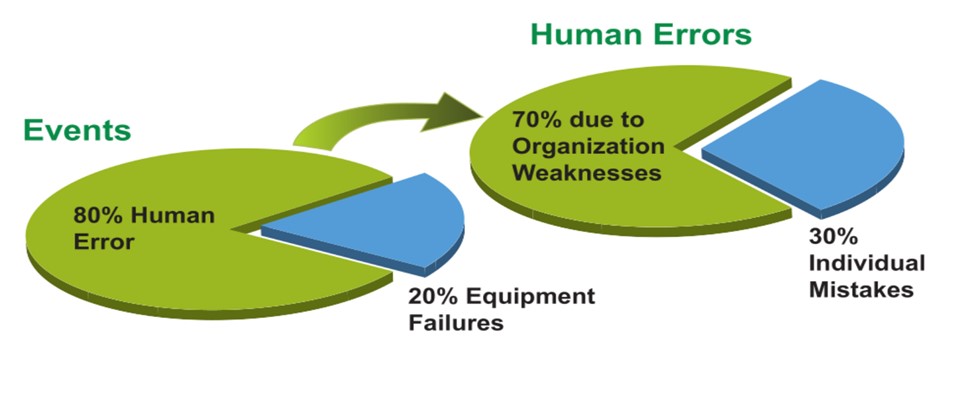
There are already many scientific tools to help us understand the physical causes for machine failures; the challenge now is to find a way of investigating human performance failure modes. Driven in part by the public outcry over seminal events such as airplane accidents and nuclear power plant accidents, several pioneers, like Jens Rasmussen and Dr. James Reason, have provided several powerful conceptual models to enable us to understand why humans are often a major source of slips, lapses, and mistakes. This book will translate some of these pioneering conceptual models into easy-to-use, cause investigation-related tools and templates.
- Chapter 1 will lay out a process to determine the level of effort should encompass. Having identified the kind of investigation needed, a strong, clear structure for conducting it is essential.
- Chapters 2 through 5 presents a new and innovative structure to identify the underlying causes for the event (The Cause Road Maps) and conducting the investigation, while Chapter 6 introduces some conceptual human performance models and how to begin focusing on the human behaviors involved. Understanding that human behaviors are a critical part of any investigation, it necessarily follows that carefully interviewing personnel, as discussed in Chapter 7, is of utmost importance. Techniques and tools for this are presented in Chapter 8.
- Finally, Chapters 9 through 13 detail how to “put the pieces together:” They analyze and model the event, determine corrective action, and document the investigations and findings.
As noted above, the book introduces the use of the Cause Road Map, which I developed over my years in the business. (Also copyrighted as The Cause Roadmap©). This multi-function event
investigation tool provides a structured approach to finding the underlying causes for events. It will provide a comprehensive taxonomy for every cause investigation. It is not, however, intended to be used alone. The Cause Road Map requires the use of other tools provided in this book and by others to organize, analyze, and present the results of your investigation.
This book will also present:
- Investigation Rigor Selection Tool
- Tool Types and Use Matrix
- Common Cause Analysis
- Commonalities Matrix
- Interviewing Techniques
- Comparative Event Line
- Hardware/Material/Design Failure Evaluation Summary
- Failure Modes and Effects Analysis Worksheet
- Performance Evaluation Summary
- Barrier Analysis
- Event and Causal Factor Chart
- The Why Tree (Described by and used with permission from Dr. William B. Corcoran) – 5 Why’s, Two Factor & Structured
- Change Analysis
- Task Analysis Worksheet
- Corrective and Preventive Action Development Guidelines
- A Rigorous Cause Analyses (RCA) Template
- Structured Cause Investigation Report Template
- Presentation Tips
- A graphic to enable recognition and management of Knowledge-based decisions.
Recently, the European Joint Research Center-Institute for Energy (JRC-IE) published a comparative analysis of event investigation methods, tools and techniques. One of their principal conclusions was: “Unstructured processes of root cause analysis put too much emphasis on opinions, take too long, and do not produce effective corrective measures or lasting results” (Ziedelis & Noel, 2011).
The purpose of this book is to reduce the time it takes to perform a thorough and insightfull investigation through the use of simple, easy-to-use tools. Although this JRC-IE report did not address the Cause Road Map taxonomy, the above conclusion prompted a critical re-assessment of the structure, precision, and comprehensiveness of the tool set that I presented in my earlier book, The Excellence Engine Tool Kit. The new content in this current book resulted in part from this re-assessment as well as some more recent real-world experiences.

 Chester D Rowe